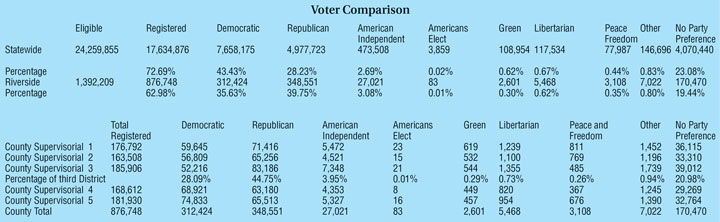


Given the upcoming general election, while Democrats represent 44.3 percent of the registered voters in California, the local registration tilts toward Republicans. Total state registration is higher than four years ago.
Republicans are 39.8 percent of total Riverside County registered voters but only 28.2 percent of the statewide electorate. Republican registrants have been declining for nearly two decades.
In California, 7.7 million registered Democrats represent 43.4 percent of total party registration, but less than the 46.7 percent Democratic registration in 1998. That is nearly 2.7 million more than Republicans who only outnumber individuals with no party preference by 900,000 voters. The number of voters choosing no party preference has grown from 12.6 percent of voters in 1998 to 23.1 percent in September 2014.
In Riverside County, Democrats are 35.6 percent. No party preference was the choice of 19.4 percent.
According to the secretary of state, the 876,748 registered county voters represent 63 percent of eligible voters, whereas statewide, 72.7 percent of eligible voters have registered.
Within county Supervisorial District 3 (which includes all of the Hill neighborhoods), Republicans dominate the party choices, representing 44.8 percent of registered voters. The 3rd District includes 83,136 registered Republicans, the greatest number of the county’s five supervisorial districts. And registered Democrats number 52,216 or 28.1 percent, which is the least of the five. No preference was the choice of 21 percent of the local voters. The 39,012 with no party preference are the greatest number of the five districts.
The 3rd District has 185,906 registered voters, which is the most of all five supervisorial districts.